
Analytics
Analytics shows the current organization’s live streams through real-time values and time-series data.
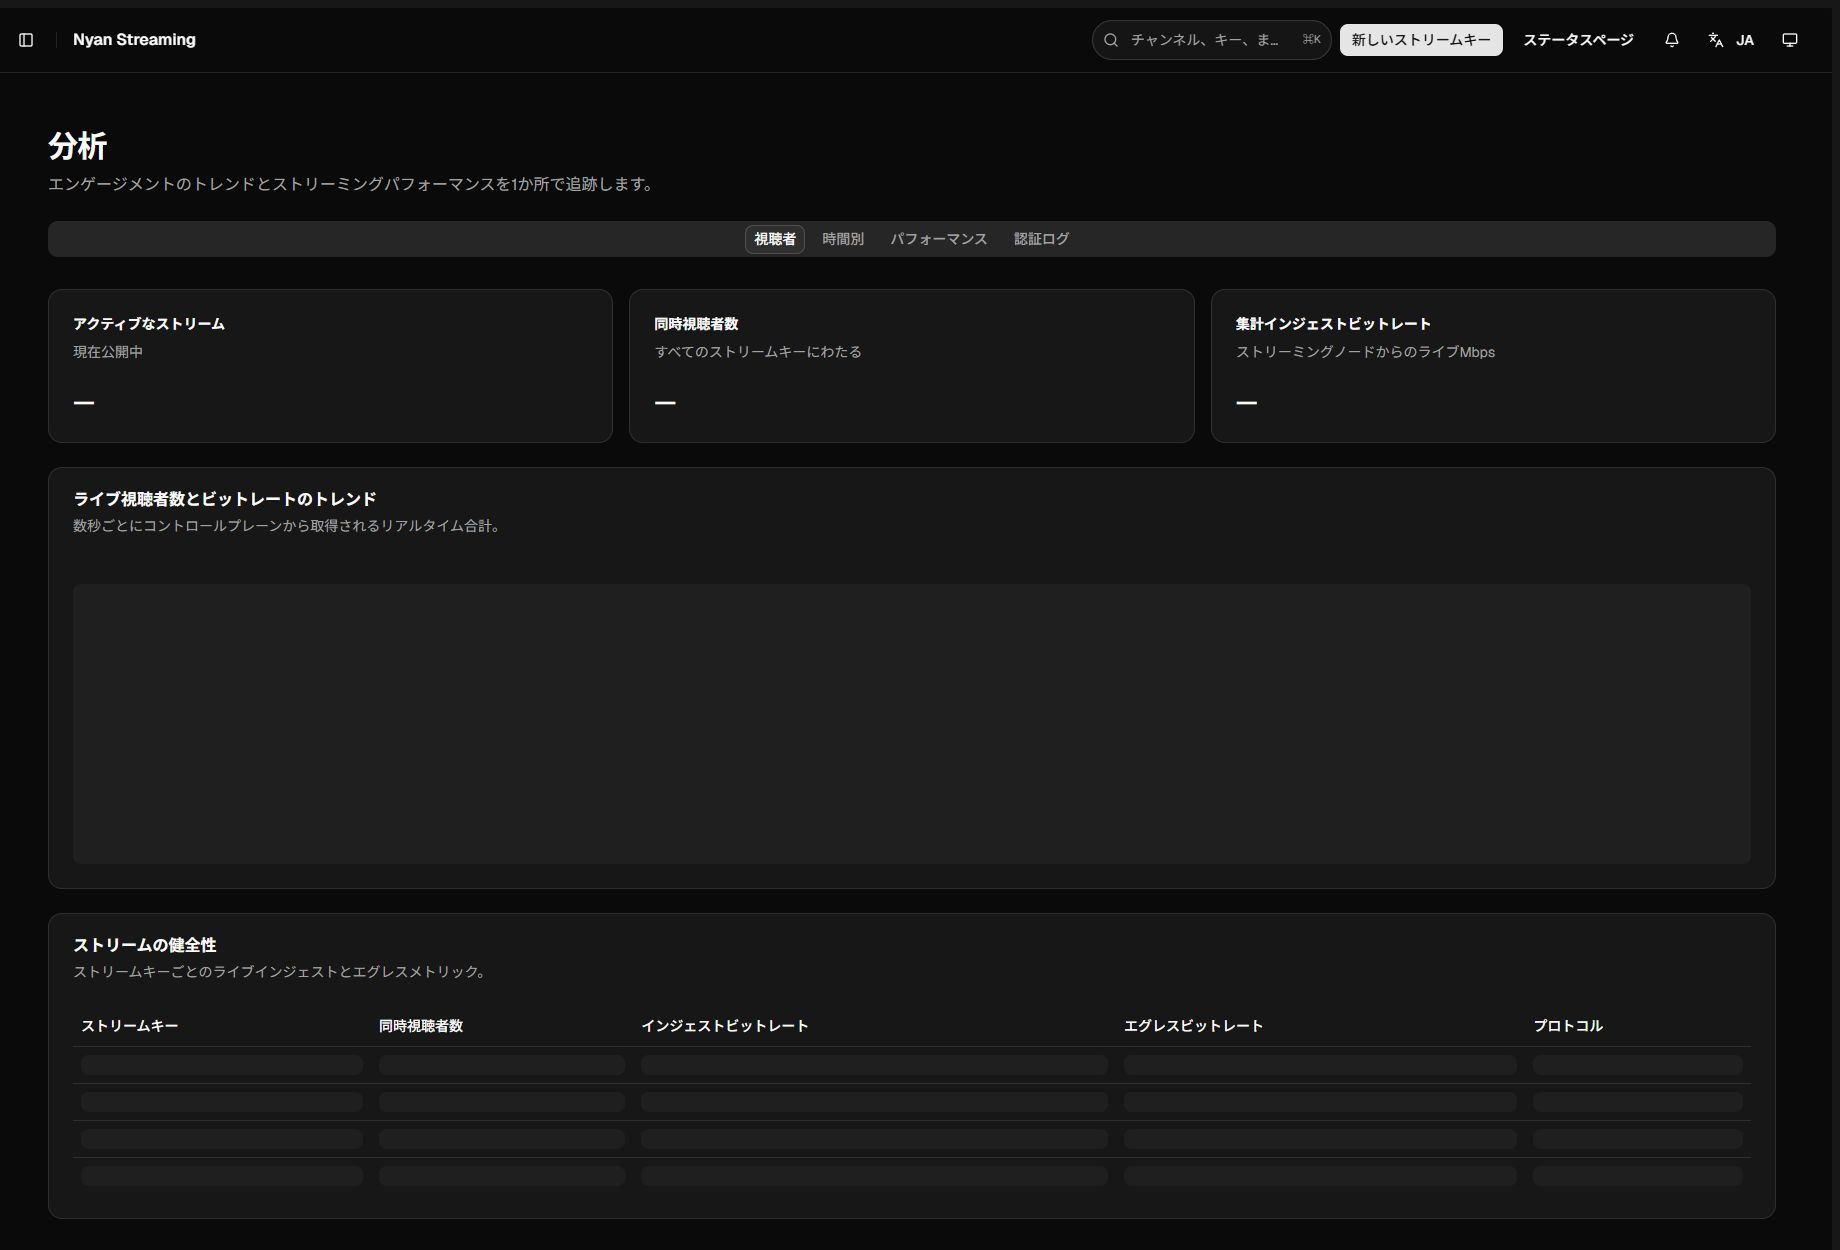
Four tabs
Section titled “Four tabs”| Tab | What it shows |
|---|---|
| Viewers | Active streams, concurrent viewers, aggregate ingest bitrate, and a live chart |
| By hour | Viewer and traffic history for a selected period |
| Performance | Average ingest/egress, key rankings, and viewer protocol mix |
| Authentication log | Recent publish authentication result, user, IP address, and time |
Viewers and stream health
Section titled “Viewers and stream health”The live chart polls organization-wide values from the control plane every few seconds. Stream health compares concurrent viewers, ingest/egress bitrate, and active playback protocols for each key.
Ingest is traffic from the publisher into the server; egress is traffic from the server to viewers. If ingest stays at zero, inspect the publishing side. If egress does not rise, verify the playback URL and authentication.
Performance
Section titled “Performance”Review stream keys ranked by ingest bitrate, the HLS/WHEP/RTSP protocol mix, per-stream averages, and the last update time. This is useful before and after changing encoder or playback settings.
Authentication log
Section titled “Authentication log”Monitor successful and failed publish authentication attempts. Repeated failures usually call for checking the stream key, ingest secret, publish URL, and source-IP rules. The secret itself is never displayed in the log.